27 Mar 2025
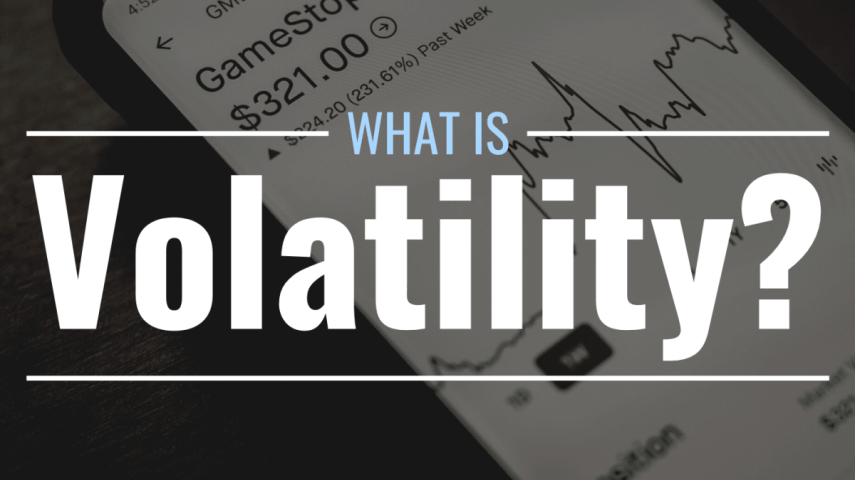
What you need to know about volatility
Let's delve into the topic of volatility, an essential concept for understanding options trading and investments. To grasp these concepts effectively, we need to discuss them detail.
Implied volatility (IV) represents the market's anticipation of a stock's potential future movement. On the other hand, historical volatility (HV) measures the actual past movement of the stock.
Before initiating an options trade, it is crucial to analyze the existing relationship between IV and HV. This is similar to how a technical analyst examines stock charts. By studying a stock's past behavior, one can often predict its future behavior. Similarly, for options, HV serves as a reliable indicator for the possible direction of IV. Hence, it is important to identify any disparities between the two.
It is not uncommon for historical volatility and implied volatility to deviate from each other.
In the lower section of the chart above, you can observe two lines intersect each other, representing implied and historical volatility. The light blue line represents historical volatility (HV), while the red line represents implied volatility (IV).
Discrepancies between implied and historical volatility can occur due to various reasons. One common scenario is when a company is about to announce its earnings. Prior to the announcement, uncertainty prevails, leading to an increase in options prices as speculators and hedgers become active in the market. However, once the earnings are released, the uncertainty dissipates, resulting in a collapse of implied volatility.
For instance, on June 13, 2017, H&R Block released its quarterly earnings, and the following day, implied volatility significantly decreased.
It is crucial to consider implied volatility before entering an options position and evaluate whether it is relatively expensive or cheap.
When there is a significant difference between implied volatility and historical volatility, it is advisable to investigate if there is a known event or recent occurrence that can explain the disparity. If there is no identifiable reason, it often makes sense to buy options when historical volatility is higher than implied volatility and sell options when implied volatility is higher than historical volatility.
Comparing implied volatility over a period of time is another way to assess whether options are relatively expensive or not. In the example provided, H&R Block's implied volatility fluctuated within a range of 20.7% to 51.8%. Consequently, buying options with a 25% implied volatility would be considered relatively cheap.
Several factors can cause option volatility to rise, including uncertainty, fear, and greed. Implied volatility tends to increase more quickly during stock sell-offs due to heightened demand for put protection, which makes hedging more expensive.
Various events can contribute to uncertainties, such as market sell-offs, FDA announcements, earnings announcements, legal actions against a company, regulatory actions, analyst day events, rumors of a takeover, and any development that raises doubts about a stock's future performance. Once the uncertainty subsides and the market absorbs the information, implied volatility is expected to decrease.
In the next section, we will discuss the sensitivities, or Greeks, and how different components affect the value of an option.